Updated Climate Change Module!
You may have read this post a while back detailing my first draft of materials for a Climate Change module developed with the support of a USC Center for Teaching Excellence GTA Teaching Resource Development Grant.
After trialing this lab in my classes in Fall 2024, I presented some updated versions to our lab coordinator as well as the other teaching assistants. After incorporating some helpful feedback from them, I created the latest versions and we implemented the module across all 10 sections being taught this year (~230 students). I’m really happy with the newer version; the lab got some really great feedback from both students and instructors.
An updated versions of these lab materials are available here.
A quick summary of updates are:
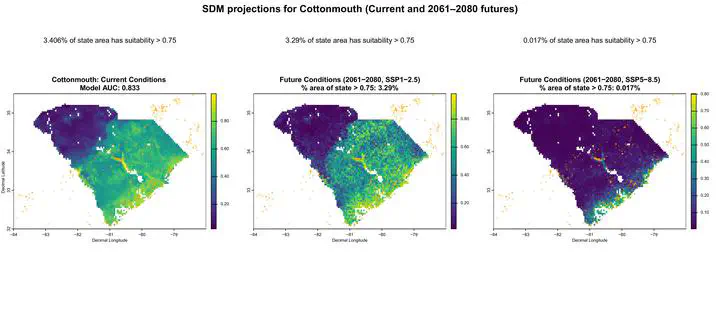
- Incorporating a second SSP climate projection (2.6). Instead of just using the most extreme warming scenario (SSP 8.5), students compare the two climate scenarios. The model still runs as one function, but now gives three output maps (current conditions, 2061-2080 under SSP 2.6, and 2061-2080 under SSP 8.5)
- Model Realism Improvements: The previous version of this model only used WORLDCLIM predictors (after getting rid of collinearity through a PCA reduction). These are still likely the most important and did fairly well, but both to increase performance and get students thinking about more factors that could limit species distributions, I added elevation, soil charactersistics (ph, carbon content, sand and silt content), and a course vegetation measure (average Summer & Winter NDVI from 2024).
- Model Efficiency + Intermediate Data Products: To make the model run faster on the lab computers, I cut down a lot of the analysis that was previously done in the main function and instead saved intermediate products as part of the module materials. This increased speed significantly: On lab computers students could run the models on ~7k species in under 2min, which is plenty fast enough for our purposes.
- Various small things, including improving plotting outputs, clarifying a few worksheet questions, etc.
I’m very happy with how implementation across sections went this semester. I gave a simple Likert self-assessment of students’ confidence in their ability to meet the associated Learning Objectives before the lab & one week after the lab, and unsurprisingly student self-assessment scores increased significantly across all the LOs I asked about.
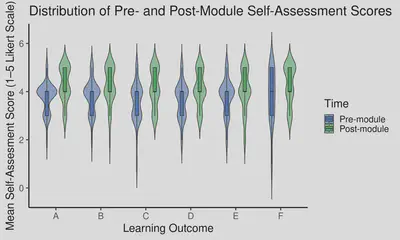
A) I understand some of the basic mechanisms of Climate Change (CC) and some evidence we have supporting these mechanisms. (Mean increase of 0.5, p=0.002)
B) I can describe some of the different impacts CC has across ecosystems (Mean increase of 0.375, p=0.037)
C) I can describe some of the factors that control species geographic ranges (Mean increase of 0.625, p=0.001)
D) I can make predictions about how species ranges may shift with CC (Mean increase of 0.625, p=0.001)
E) I understand some of the mechanisms in which natural populations may respond to CC (Mean increase of 0.375, p=0.012)
F) I understand some of the mechanisms in which natural populations may respond to CC (Mean increase of 0.5, p=0.027)